
最新的Tableau Certified Consultant - TCC-C01免費考試真題
From the desktop, open the CC workbook.
Open the Incremental worksheet.
You need to add a line to the chart that
shows the cumulative percentage of sales
contributed by each product to the
incremental sales.
From the File menu in Tableau Desktop, click
Save.
Open the Incremental worksheet.
You need to add a line to the chart that
shows the cumulative percentage of sales
contributed by each product to the
incremental sales.
From the File menu in Tableau Desktop, click
Save.
正確答案:
See the complete Steps below in Explanation:
Explanation:
To add a line showing the cumulative percentage of sales contributed by each product to the incremental sales in the Incremental worksheet of your Tableau Desktop, follow these detailed steps:
* Open the CC Workbook and Access the Worksheet:
* From the desktop, double-click on the CC workbook to open it in Tableau Desktop.
* Navigate to the Incremental worksheet by clicking on its tab at the bottom of the window.
* Calculate Cumulative Sales Percentage:
* Create a new calculated field to compute the cumulative percentage of sales. Right-click in the Data pane and select 'Create Calculated Field'.
* Name this field "Cumulative Sales Percentage".
* Enter the following formula to calculate the running sum of sales as a percentage of the total sales:
(RUNNING_SUM(SUM([Sales])) / TOTAL(SUM([Sales])) [Sales]))
* Click 'OK' to save the calculated field.
* Add the Cumulative Sales Percentage Line to the Chart:
* Drag the "Cumulative Sales Percentage" field to the Rows shelf, placing it next to the existing Sales measure.
* Ensure that the cumulative line appears as a continuous line. Right-click on the "Cumulative Sales Percentage" field on the Rows shelf, select 'Change Chart Type', and choose 'Line'.
* Adjust the axis to synchronize or dual-axis if necessary. Right-click on the axis of the
"Cumulative Sales Percentage" and select 'Synchronize Axis' if it's on a dual-axis setup.
* Format the Cumulative Sales Percentage Line:
* Click on the "Cumulative Sales Percentage" line in the visualization.
* Navigate to the 'Format' pane to adjust the line style, thickness, and color to make it distinct from other data in the chart.
* Save Your Changes:
* From the File menu, click 'Save' to ensure all your changes are stored.
References:
* Tableau Help: Provides additional details on creating calculated fields and customizing line charts.
* Tableau User Guide: Offers extensive instructions on formatting charts, including line types and axis synchronization.
By following these steps, you will successfully add a cumulative sales percentage line to your chart, enhancing the visualization to reflect the incremental contribution of each product to the overall sales in a dynamic and informative manner.
Explanation:
To add a line showing the cumulative percentage of sales contributed by each product to the incremental sales in the Incremental worksheet of your Tableau Desktop, follow these detailed steps:
* Open the CC Workbook and Access the Worksheet:
* From the desktop, double-click on the CC workbook to open it in Tableau Desktop.
* Navigate to the Incremental worksheet by clicking on its tab at the bottom of the window.
* Calculate Cumulative Sales Percentage:
* Create a new calculated field to compute the cumulative percentage of sales. Right-click in the Data pane and select 'Create Calculated Field'.
* Name this field "Cumulative Sales Percentage".
* Enter the following formula to calculate the running sum of sales as a percentage of the total sales:
(RUNNING_SUM(SUM([Sales])) / TOTAL(SUM([Sales])) [Sales]))
* Click 'OK' to save the calculated field.
* Add the Cumulative Sales Percentage Line to the Chart:
* Drag the "Cumulative Sales Percentage" field to the Rows shelf, placing it next to the existing Sales measure.
* Ensure that the cumulative line appears as a continuous line. Right-click on the "Cumulative Sales Percentage" field on the Rows shelf, select 'Change Chart Type', and choose 'Line'.
* Adjust the axis to synchronize or dual-axis if necessary. Right-click on the axis of the
"Cumulative Sales Percentage" and select 'Synchronize Axis' if it's on a dual-axis setup.
* Format the Cumulative Sales Percentage Line:
* Click on the "Cumulative Sales Percentage" line in the visualization.
* Navigate to the 'Format' pane to adjust the line style, thickness, and color to make it distinct from other data in the chart.
* Save Your Changes:
* From the File menu, click 'Save' to ensure all your changes are stored.
References:
* Tableau Help: Provides additional details on creating calculated fields and customizing line charts.
* Tableau User Guide: Offers extensive instructions on formatting charts, including line types and axis synchronization.
By following these steps, you will successfully add a cumulative sales percentage line to your chart, enhancing the visualization to reflect the incremental contribution of each product to the overall sales in a dynamic and informative manner.
For a new report, a consultant needs to build a data model with three different tables, including two that contain hierarchies of locations and products. The third table contains detailed warehousing data from all locations across six countries. The consultant uses Tableau Cloud and the size of the third table excludes using an extract.
What is the most performant approach to model the data for a live connection?
What is the most performant approach to model the data for a live connection?
正確答案: B
A client is searching for ways to curate and document data in order to obtain data lineage. The client has a data source connected to a data lake.
Which tool should the consultant recommend to meet the client's requirements?
Which tool should the consultant recommend to meet the client's requirements?
正確答案: C
說明:(僅 Fast2test 成員可見)
A client collects information about a web browser customers use to access their website. They then visualize the breakdown of web traffic by browser version.
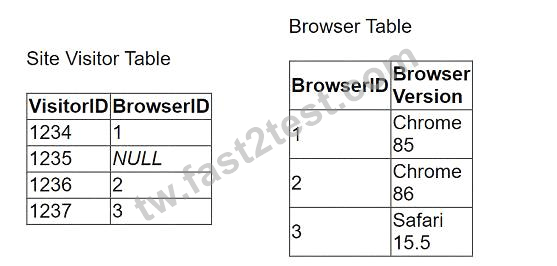
The data is stored in the format shown below in the related table, with a NULL BrowserID stored in the Site Visitor Table if an unknown browser version accesses their website.
The client uses "Some Records Match" for the Referential Integrity setting because a match is not guaranteed.
The client wants to improve the performance of
the dashboard while also getting an accurate count of site visitors.
Which modifications to the data tables and join should the consultant recommend?
The data is stored in the format shown below in the related table, with a NULL BrowserID stored in the Site Visitor Table if an unknown browser version accesses their website.
The client uses "Some Records Match" for the Referential Integrity setting because a match is not guaranteed.
The client wants to improve the performance of
the dashboard while also getting an accurate count of site visitors.
Which modifications to the data tables and join should the consultant recommend?
正確答案: A
說明:(僅 Fast2test 成員可見)
A client has several long-term shipping contracts with different vendors that set rates based on shipping volume and speed. The client requests a dashboard that allows them to model shipping costs for the next week based on the selected shipping vendor. Speed for the end user is critical.
Which dashboard building strategy will deliver the desired result?
Which dashboard building strategy will deliver the desired result?
正確答案: C
說明:(僅 Fast2test 成員可見)
A client is working in Tableau Prep and has a field named Orderld that is compiled by country, year, and an order number as shown in the following table.
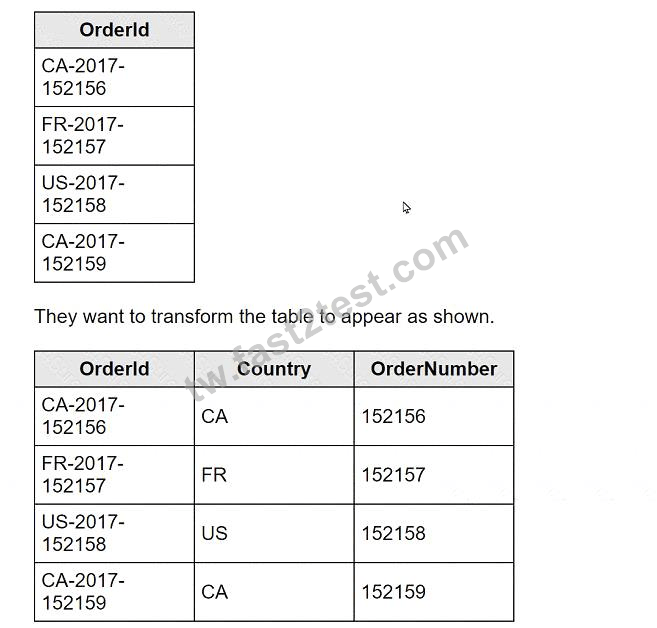
What should the consultant use to transform the table in the most efficient manner?
What should the consultant use to transform the table in the most efficient manner?
正確答案: C
說明:(僅 Fast2test 成員可見)