
最新的Microsoft Analyzing and Visualizing Data with Microsoft Excel - 070-779免費考試真題
You have an Excel workbook that contains two tables named User and Activity.
You plan to publish the workbook to the Power BI service.
Users will use Q&A in the Power BI service to perform natural language queries.
You need to ensure that the users can query the term employee and receive results from the User table.
What should you do before you publish to Power BI?
You plan to publish the workbook to the Power BI service.
Users will use Q&A in the Power BI service to perform natural language queries.
You need to ensure that the users can query the term employee and receive results from the User table.
What should you do before you publish to Power BI?
正確答案: C
You have a table that contains the following data.

You need to create a PivotTable as shown in the exhibit. (Click the Exhibit button.)

How should you configure the PivotTable? To answer, drag the appropriate fields to the correct areas. Each field may be used once, more than once, or not at all. You may need to drag the split bar between panes or scroll to view content.
NOTE: Each correct selection is worth one point.

You need to create a PivotTable as shown in the exhibit. (Click the Exhibit button.)
How should you configure the PivotTable? To answer, drag the appropriate fields to the correct areas. Each field may be used once, more than once, or not at all. You may need to drag the split bar between panes or scroll to view content.
NOTE: Each correct selection is worth one point.
正確答案:

Explanation

Box 1: Columns: Customers
Box 2: Rows: Products
Box 3: Values: Quantity
Box 4: Filters: Country
You have a query that retrieves customers and their locations. You have a sample of the data as shown in the following table.

Additional customers and locations are added frequently.
You need to transform the data as shown in the following table.

What should you do?
Additional customers and locations are added frequently.
You need to transform the data as shown in the following table.
What should you do?
正確答案: B
You have a data model in Excel.
You export the data and the data model into a dataset in the Microsoft Power BI service.
What can you use to modify the data model that is published to the Power BI service?
You export the data and the data model into a dataset in the Microsoft Power BI service.
What can you use to modify the data model that is published to the Power BI service?
正確答案: C
From a workbook query, you import a table that has the following data.

You need to configure the table to appear as shown in the following table.

What should you do?
You need to configure the table to appear as shown in the following table.
What should you do?
正確答案: D
Note: This question is part of a series of questions that present the same scenario. Each question in the series contains a unique solution that might meet the stated goals. Some question sets might have more than one correct solution, while others might not have a correct solution.
After you answer a question in this section, you will NOT be able to return to it As a result, these questions will not appear in the review screen.
You have an Excel workbook that contains a table named Table1. A sample of the data in Table1 is shown in the following table.

You need to create a PivotTable in PowerPivot as shown in the exhibit.

Solution: You create a hierarchy named Products that contains ProductCategory, Solution: You create a measure named Products the uses the DataTable DAX Function. You add a PivotTable.
You drag products to the Rows field. You drag Price to the Values field.
Does this meet the goal?
After you answer a question in this section, you will NOT be able to return to it As a result, these questions will not appear in the review screen.
You have an Excel workbook that contains a table named Table1. A sample of the data in Table1 is shown in the following table.
You need to create a PivotTable in PowerPivot as shown in the exhibit.
Solution: You create a hierarchy named Products that contains ProductCategory, Solution: You create a measure named Products the uses the DataTable DAX Function. You add a PivotTable.
You drag products to the Rows field. You drag Price to the Values field.
Does this meet the goal?
正確答案: A
Note: This question is part of a series of questions that use the same scenario, For your convenience the scenario is repeated in each question. Each question presents a different goal and answer choices, but the text of the scenario is the same in each question in this series.
Start of repeated scenario
You are creating reports for a car repair company. You have four datasets in Excel spreadsheets. Four workbook queries load the datasets to a data model. A sample of the data is shown in the Data Sample exhibit.

The data model is shown in the Data Model exhibit.

The tables in the model contain the following data:
DailyRepairs has a log of hours and revenue for each day, workshop, and repair type. Every day, a log entry is created for each workshop, even if no hours or revenue are recorded for that day. Total Hours and Total Revenue are two measures defined in DailyRepairs. Total Hours sums the Hours column, and Total Revenue sums the Revenue column.
Workshops has a list of all the workshops and the current and previous workshop managers. The format of the Workshop Manager column is always Firstname Lastname. A value of 1 in the IsLatest column indicates that the workshop manager listed in the record is the current workshop manager.
RepairTypes has a list of alt the repair types.
Dates has a list of dates from 2015 to 2018.
End of repeated scenario.
You plan to analyze The average revenue per hour by combinations of day, repair type, and workshop name.
You need to create a measure to support the planned analysis.
Which DAX formula should you use? To answer, drag the appropriate values to the correct targets. Each value may be used once, more than once, or not at all. You may need to drag the split bar between panes or scroll to view content.
NOTE: Each correct selection is worth one point.

Start of repeated scenario
You are creating reports for a car repair company. You have four datasets in Excel spreadsheets. Four workbook queries load the datasets to a data model. A sample of the data is shown in the Data Sample exhibit.
The data model is shown in the Data Model exhibit.
The tables in the model contain the following data:
DailyRepairs has a log of hours and revenue for each day, workshop, and repair type. Every day, a log entry is created for each workshop, even if no hours or revenue are recorded for that day. Total Hours and Total Revenue are two measures defined in DailyRepairs. Total Hours sums the Hours column, and Total Revenue sums the Revenue column.
Workshops has a list of all the workshops and the current and previous workshop managers. The format of the Workshop Manager column is always Firstname Lastname. A value of 1 in the IsLatest column indicates that the workshop manager listed in the record is the current workshop manager.
RepairTypes has a list of alt the repair types.
Dates has a list of dates from 2015 to 2018.
End of repeated scenario.
You plan to analyze The average revenue per hour by combinations of day, repair type, and workshop name.
You need to create a measure to support the planned analysis.
Which DAX formula should you use? To answer, drag the appropriate values to the correct targets. Each value may be used once, more than once, or not at all. You may need to drag the split bar between panes or scroll to view content.
NOTE: Each correct selection is worth one point.
正確答案:

Explanation
DIVIDE ([Total Revenue ],[ Total Hours], BLANK())
You have a workbook query that uses an Excel data source. The data source contains the following table.
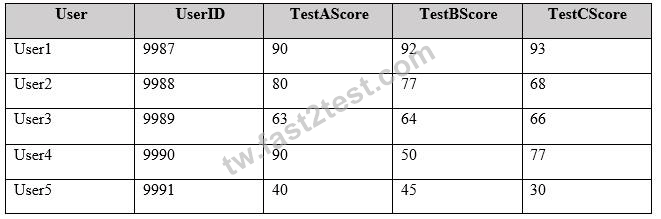
You need the data to appear as shown in the following table.

How should you transform the data from Query Editor? To answer, select the appropriate options in the answer area.
NOTE: Each correct selection is worth one point.

You need the data to appear as shown in the following table.
How should you transform the data from Query Editor? To answer, select the appropriate options in the answer area.
NOTE: Each correct selection is worth one point.
正確答案:

Explanation

Box 1: User and UserID
Box 2: Unpivot Columns
References:
https://support.office.com/en-us/article/unpivot-columns-power-query-0f7bad4b-9ea1-49c1-9d95-f588221c7098