
最新的Microsoft Analyzing and Visualizing Data with Power BI - 070-778免費考試真題
Note: This question is part of a series of questions that use the same scenario. For your convenience, the scenario is repeated in each question. Each question presents a different goal and answer choices, but the text of the scenario is exactly the same in each question in this series.
Start of repeated scenario.
You have a Microsoft SQL Server database that has the tables shown in the Database Diagram exhibit. (Click the Exhibit button.)
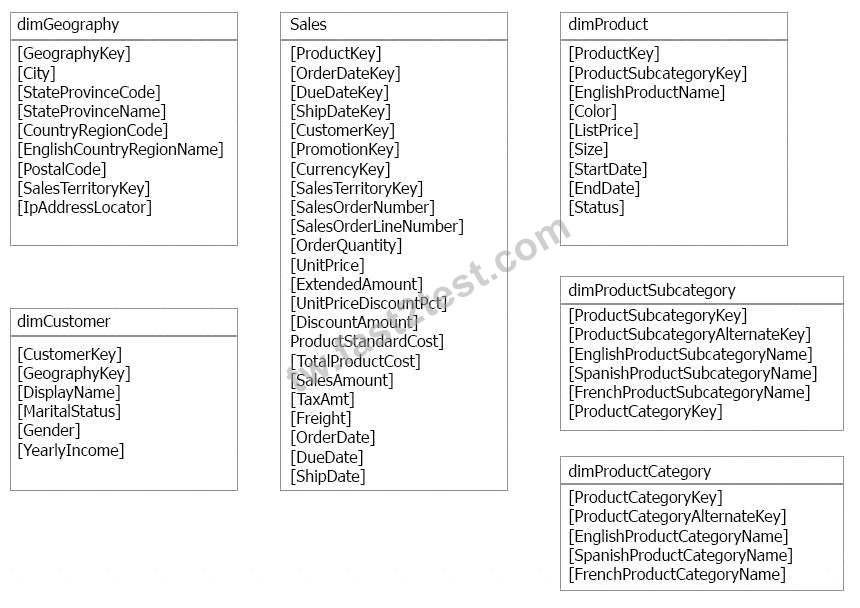
You plan to develop a Power BI model as shown in the Power BI Model exhibit. (Click the Exhibit button.)
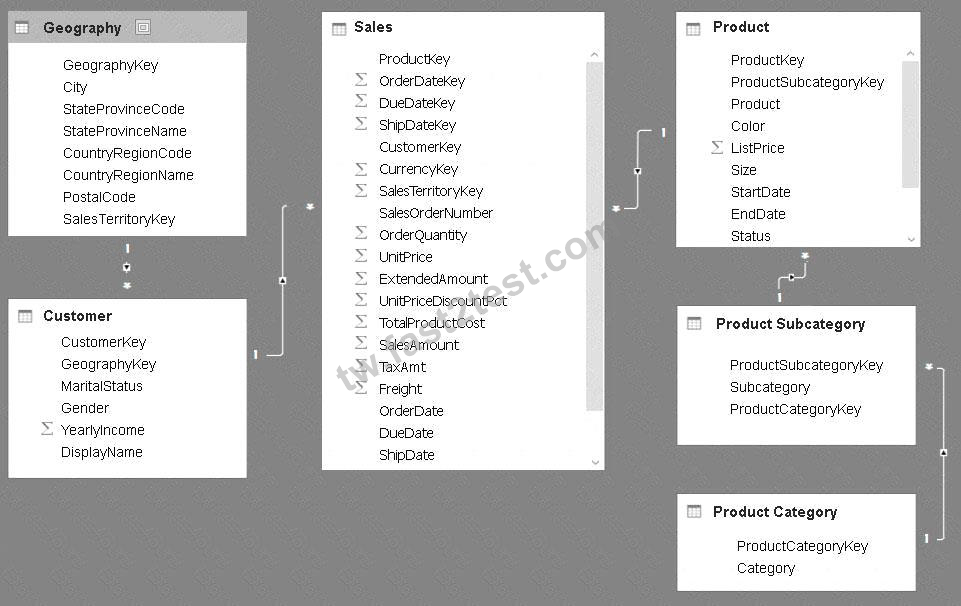
You plan to use Power BI to import data from 2013 to 2015.
Product Subcategory[Subcategory] contains NULL values.
End of Repeated Scenario.
You implement the Power BI model.
You plan to add a table named Date to the model. The table will have columns for the date, year, month, and end of the last month, and will include data from January 1, 2013 to December 31, 2015.
The Date table and the Sales table will have a relationship.
Which DAX functions should you use to create the columns?
Start of repeated scenario.
You have a Microsoft SQL Server database that has the tables shown in the Database Diagram exhibit. (Click the Exhibit button.)
You plan to develop a Power BI model as shown in the Power BI Model exhibit. (Click the Exhibit button.)
You plan to use Power BI to import data from 2013 to 2015.
Product Subcategory[Subcategory] contains NULL values.
End of Repeated Scenario.
You implement the Power BI model.
You plan to add a table named Date to the model. The table will have columns for the date, year, month, and end of the last month, and will include data from January 1, 2013 to December 31, 2015.
The Date table and the Sales table will have a relationship.
Which DAX functions should you use to create the columns?
正確答案: D
說明:(僅 Fast2test 成員可見)
You have a table named Sales. Sales contains the data shown in the following table.
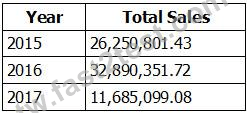
You have the following measure.
Total Sales This Year = SUM([Total Sales])
You plan to create a KPI to compare the current yearly sales to the previous year as shown in the exhibit.
(Click the Exhibit button.)

You need to create the measure for the goal.
How should you complete the DAX formula? To answer, drag the appropriate values to the correct targets.
Each value may be used once, more than once, or not at all. You may need to drag the split bar between panes or scroll to view content.
NOTE: Each correct selection is worth one point.

You have the following measure.
Total Sales This Year = SUM([Total Sales])
You plan to create a KPI to compare the current yearly sales to the previous year as shown in the exhibit.
(Click the Exhibit button.)
You need to create the measure for the goal.
How should you complete the DAX formula? To answer, drag the appropriate values to the correct targets.
Each value may be used once, more than once, or not at all. You may need to drag the split bar between panes or scroll to view content.
NOTE: Each correct selection is worth one point.
正確答案:
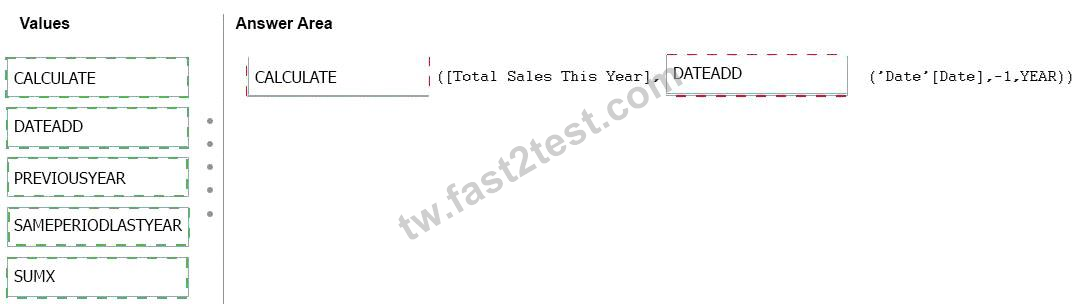
Explanation
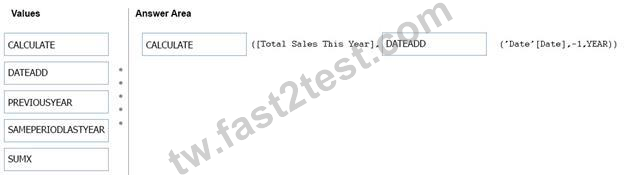
References: https://msdn.microsoft.com/query-bi/dax/dateadd-function-dax
Note: This question is part of a series of questions that present the same scenario. Each question in the series contains a unique solution that might meet the stated goals. Some question sets might have more than one correct solution, while others might not have a correct solution.
After you answer a question in this section, you will NOT be able to return to it. As a result, these questions will not appear in the review screen.
You have a Power BI model that contains two tables named Sales and Date. Sales contains four columns named TotalCost, DueDate, ShipDate, and OrderDate. Date contains one column named Date.
The tables have the following relationships:
The active relationship is on Sales[DueDate].
You need to create measures to count the number of orders by [ShipDate] and the orders by [OrderDate]. You must meet the goal without duplicating data or loading additional data.
Solution: You create two copies of the Date table named ShipDate and OrderDateGet. You create a measure that uses the new tables.
Does this meet the goal?
After you answer a question in this section, you will NOT be able to return to it. As a result, these questions will not appear in the review screen.
You have a Power BI model that contains two tables named Sales and Date. Sales contains four columns named TotalCost, DueDate, ShipDate, and OrderDate. Date contains one column named Date.
The tables have the following relationships:
The active relationship is on Sales[DueDate].
You need to create measures to count the number of orders by [ShipDate] and the orders by [OrderDate]. You must meet the goal without duplicating data or loading additional data.
Solution: You create two copies of the Date table named ShipDate and OrderDateGet. You create a measure that uses the new tables.
Does this meet the goal?
正確答案: A
You create a dashboard that displays the results of a customer satisfaction survey. You need to embed a tweet from your company's Twitter feed into the dashboard. What should you do?
正確答案: C
說明:(僅 Fast2test 成員可見)
Note: This question is part of a series of questions that present the same scenario. Each question in the series contains a unique solution that might meet the stated goals. Some question sets might have more than one correct solution, while others might not have a correct solution.
After you answer a question in this section, you will NOT be able to return to it. As a result, these questions will not appear in the review screen.
You have a Power BI model that contains two tables named Sales and Date. Sales contains four columns named TotalCost, DueDate, ShipDate, and OrderDate. Date contains one column named Date.
The tables have the following relationships:
* Sales[DueDate] and Date[Date]
* Sales[ShipDate] and Date[Date]
* Sales[OrderDate] and Date[Date]
The active relationship is on Sales[DueDate].
You need to create measures to count the number of orders by [ShipDate] and the orders by [OrderDate]. You must meet the goal without duplicating data or loading additional data.
Solution: You create measures that use the CALCULATE, COUNT, and USERELATIONSHIP DAX functions.
Does this meet the goal?
After you answer a question in this section, you will NOT be able to return to it. As a result, these questions will not appear in the review screen.
You have a Power BI model that contains two tables named Sales and Date. Sales contains four columns named TotalCost, DueDate, ShipDate, and OrderDate. Date contains one column named Date.
The tables have the following relationships:
* Sales[DueDate] and Date[Date]
* Sales[ShipDate] and Date[Date]
* Sales[OrderDate] and Date[Date]
The active relationship is on Sales[DueDate].
You need to create measures to count the number of orders by [ShipDate] and the orders by [OrderDate]. You must meet the goal without duplicating data or loading additional data.
Solution: You create measures that use the CALCULATE, COUNT, and USERELATIONSHIP DAX functions.
Does this meet the goal?
正確答案: B
說明:(僅 Fast2test 成員可見)
You plan to create a dashboard in the Power BI service that retrieves data from a Microsoft SQL Server database. The dashboard will be shared between the users in your organization.
You need to ensure that the users will see the current data when they view the dashboard.
How should you configure the connection to the data source?
You need to ensure that the users will see the current data when they view the dashboard.
How should you configure the connection to the data source?
正確答案: A
說明:(僅 Fast2test 成員可見)
Note: This question is part of a series of questions that present the same scenario. Each question in the series contains a unique solution that might meet the stated goals. Some question sets might have more than one correct solution, while others might not have a correct solution.
After you answer a question in this section, you will NOT be able to return to it. As a result, these questions will not appear in the review screen.
You have a Microsoft Excel workbook that is saved to Microsoft SharePoint Online. The workbook contains several Power View sheets.
You need to recreate the Power View sheets as reports in the Power Bl service.
Solution: From the Power Bl service, get the data from SharePoint Online, and then click Connect Does this meet the goal?
After you answer a question in this section, you will NOT be able to return to it. As a result, these questions will not appear in the review screen.
You have a Microsoft Excel workbook that is saved to Microsoft SharePoint Online. The workbook contains several Power View sheets.
You need to recreate the Power View sheets as reports in the Power Bl service.
Solution: From the Power Bl service, get the data from SharePoint Online, and then click Connect Does this meet the goal?
正確答案: A
說明:(僅 Fast2test 成員可見)
Note: This question is part of a series of questions that present the same scenario. Each question in the series contains a unique solution that might meet the stated goals. Some question sets might have more than one correct solution, while others might not have a correct solution.
After you answer a question in this section, you will NOT be able to return to it. As a result, these questions will not appear in the review screen.
You have a user named User1. User1 is a member of a security group named Contoso PowerBI.
User1 has access to a workspace named Contoso Workspace.
You need to prevent User1 from exporting data from the visualizations in Contoso Workspace.
Solution: From the Microsoft Office 365 Admin center, you modify the properties of Contoso PowerBI.
Does this meet the goal?
After you answer a question in this section, you will NOT be able to return to it. As a result, these questions will not appear in the review screen.
You have a user named User1. User1 is a member of a security group named Contoso PowerBI.
User1 has access to a workspace named Contoso Workspace.
You need to prevent User1 from exporting data from the visualizations in Contoso Workspace.
Solution: From the Microsoft Office 365 Admin center, you modify the properties of Contoso PowerBI.
Does this meet the goal?
正確答案: B
說明:(僅 Fast2test 成員可見)
You have a Power BI app named App1. The privacy for the App1 workspace is set to Private.
A user named User1 reports that App1 does not appear in the My organization AppSource. App1 appears in the My organization AppSource for your account.
You need to ensure that User sees App1 from the My organization AppSource.
What should you do?
A user named User1 reports that App1 does not appear in the My organization AppSource. App1 appears in the My organization AppSource for your account.
You need to ensure that User sees App1 from the My organization AppSource.
What should you do?
正確答案: C
說明:(僅 Fast2test 成員可見)
You have two tables named CustomerVisits and Date in a Power BI model.
You create a measure to calculate the number of customer visits. You use the measure in the report shown in the exhibit. (Click the Exhibit.)
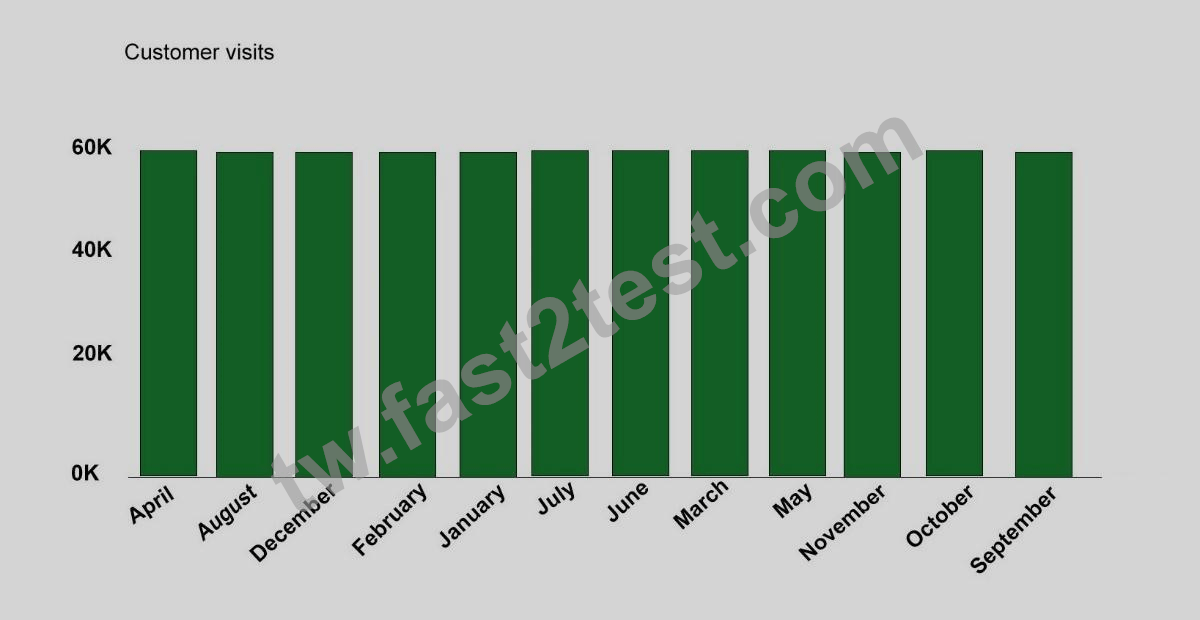
You discover that the total number of customer visits was 60,000, and that there were only 5,000 customer visits in August.
You need to fix the report to display the correct data for each month.
What should you do?
You create a measure to calculate the number of customer visits. You use the measure in the report shown in the exhibit. (Click the Exhibit.)
You discover that the total number of customer visits was 60,000, and that there were only 5,000 customer visits in August.
You need to fix the report to display the correct data for each month.
What should you do?
正確答案: C
說明:(僅 Fast2test 成員可見)
Your organization has a Microsoft Office 365 subscription.
When the users attempt to access the Power BI Service, they receive the error message shown in the exhibit.
(Click the Exhibit button.)

You need to ensure that all the users can access the Power BI service.
What should you do first?
When the users attempt to access the Power BI Service, they receive the error message shown in the exhibit.
(Click the Exhibit button.)
You need to ensure that all the users can access the Power BI service.
What should you do first?
正確答案: D
說明:(僅 Fast2test 成員可見)